Nov 21, 2010 0
Oct 31, 2010 0
Facts about Social Gaming
Oct 8, 2010 0
Turn your data into visuals!
A joint collaboration between Google & IBM Research.
“Visuals are cognitively efficient” and they are critical in the new journalism arena.
Journalism in the Age of Data from Geoff McGhee on Vimeo.
Try it here.
May 4, 2010 0
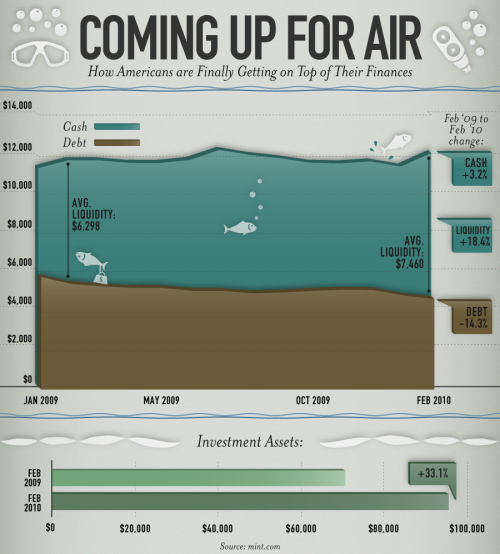
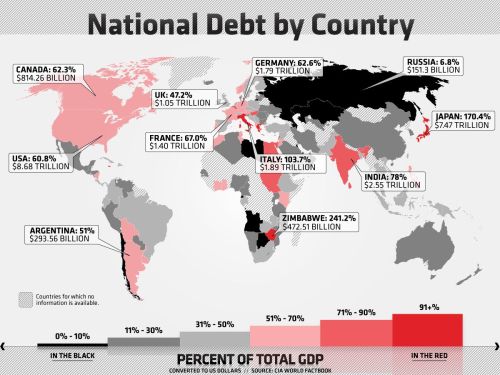
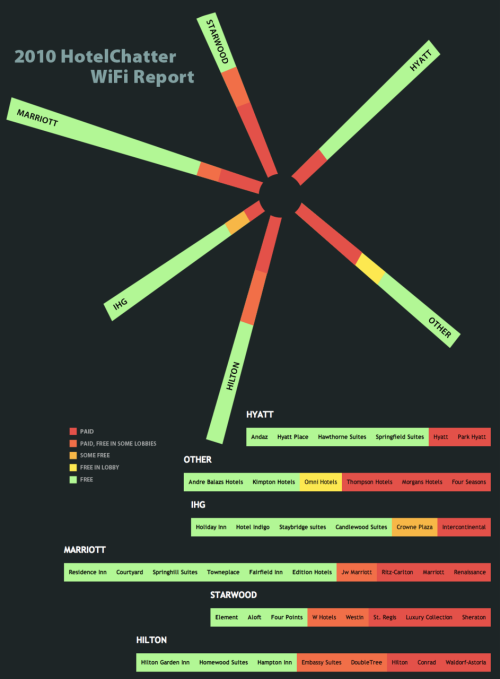
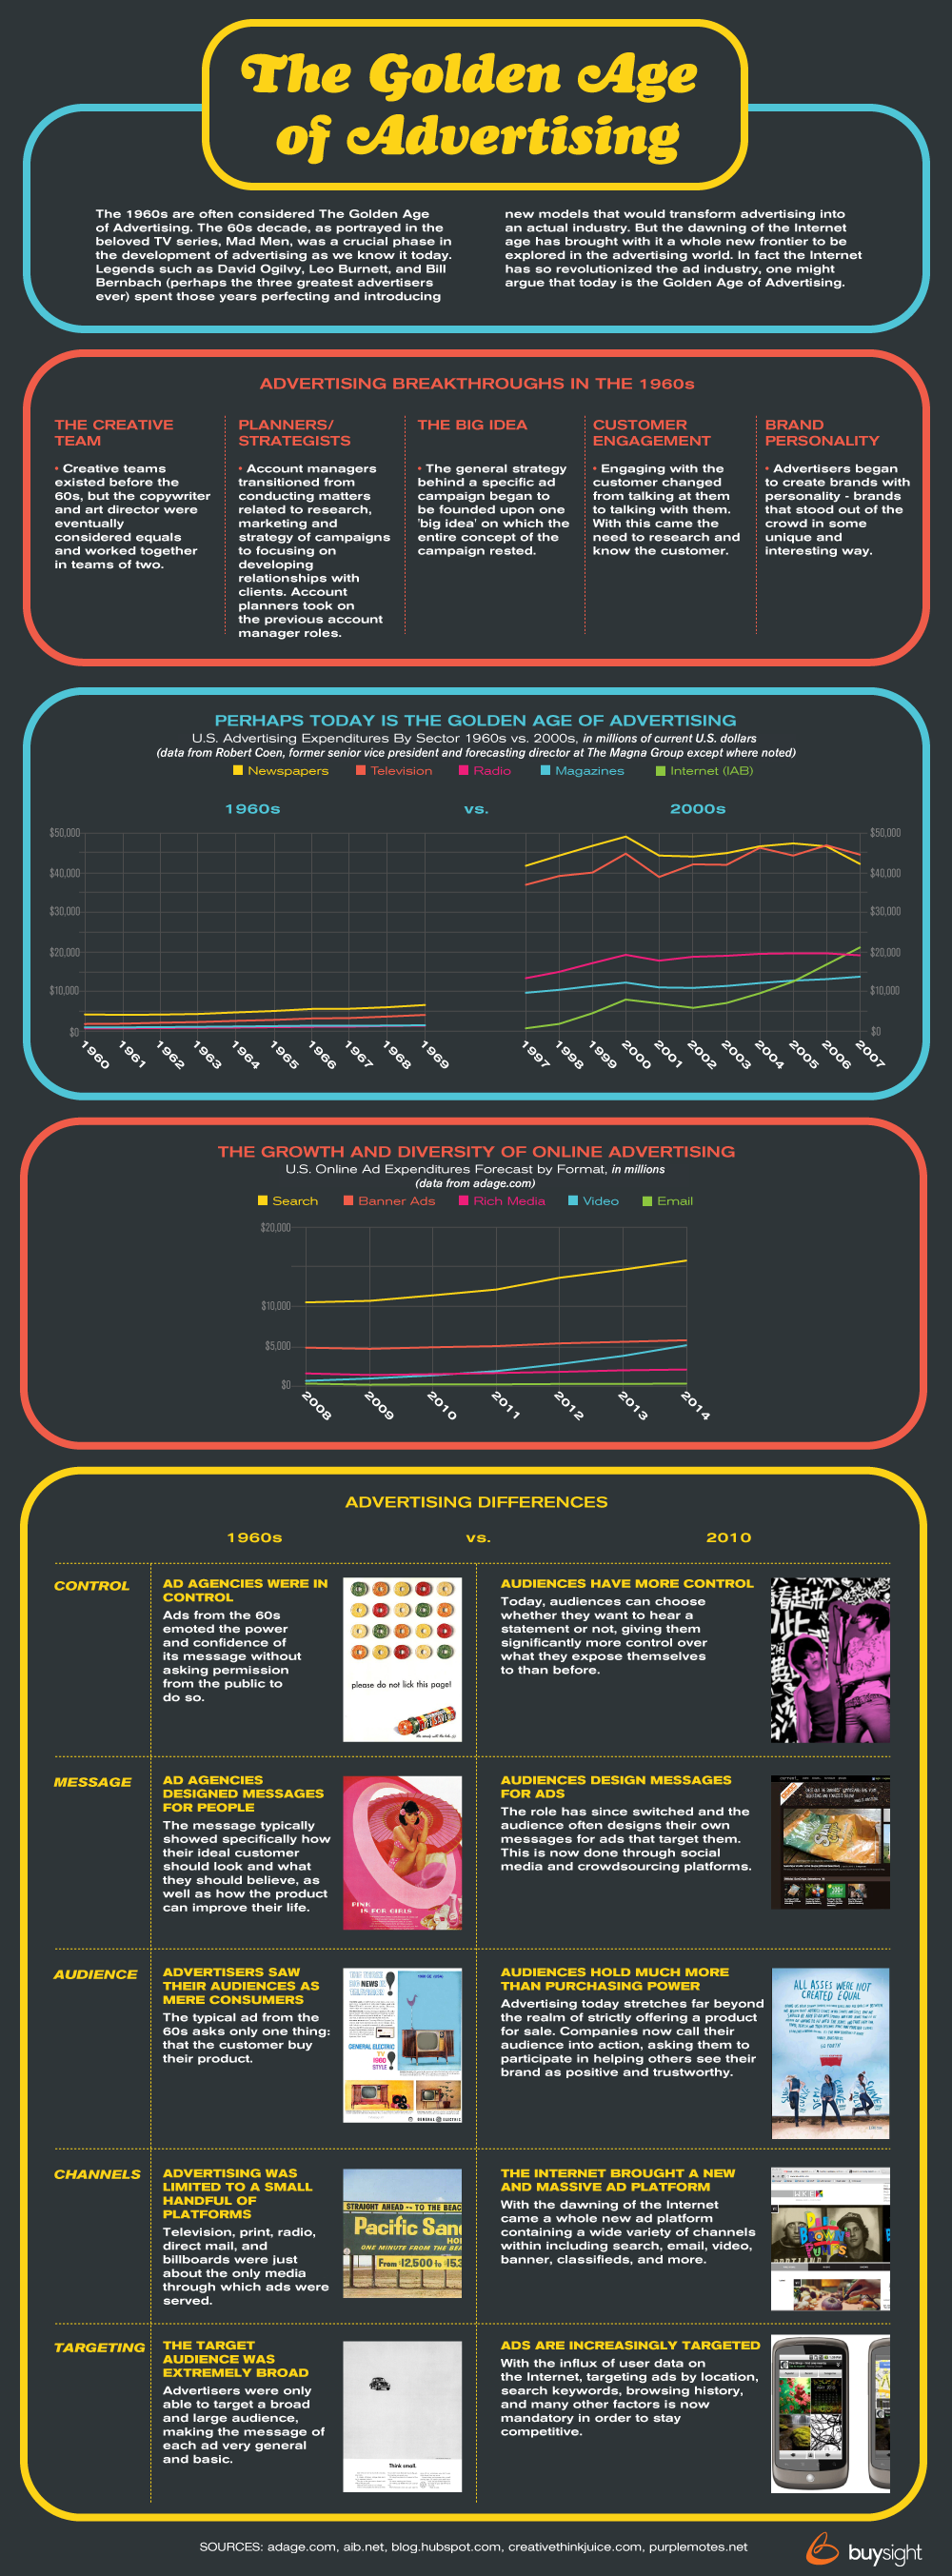
Infographics by WeLoveDatavis
WeLoveDatavis is an inspirational collection of Charts, Maps, Graphs, Diagrams — sometimes more data art than information visualization.
I always feel that information coupled with graphics/strong visual elements is so much easier to digest when we need to learn some hard, cold facts. Why hasn’t MOE do something to our oh-so-boring textbooks already?


(Via WeLoveDatavis)


